BASALT CAPITAL PARTNERS
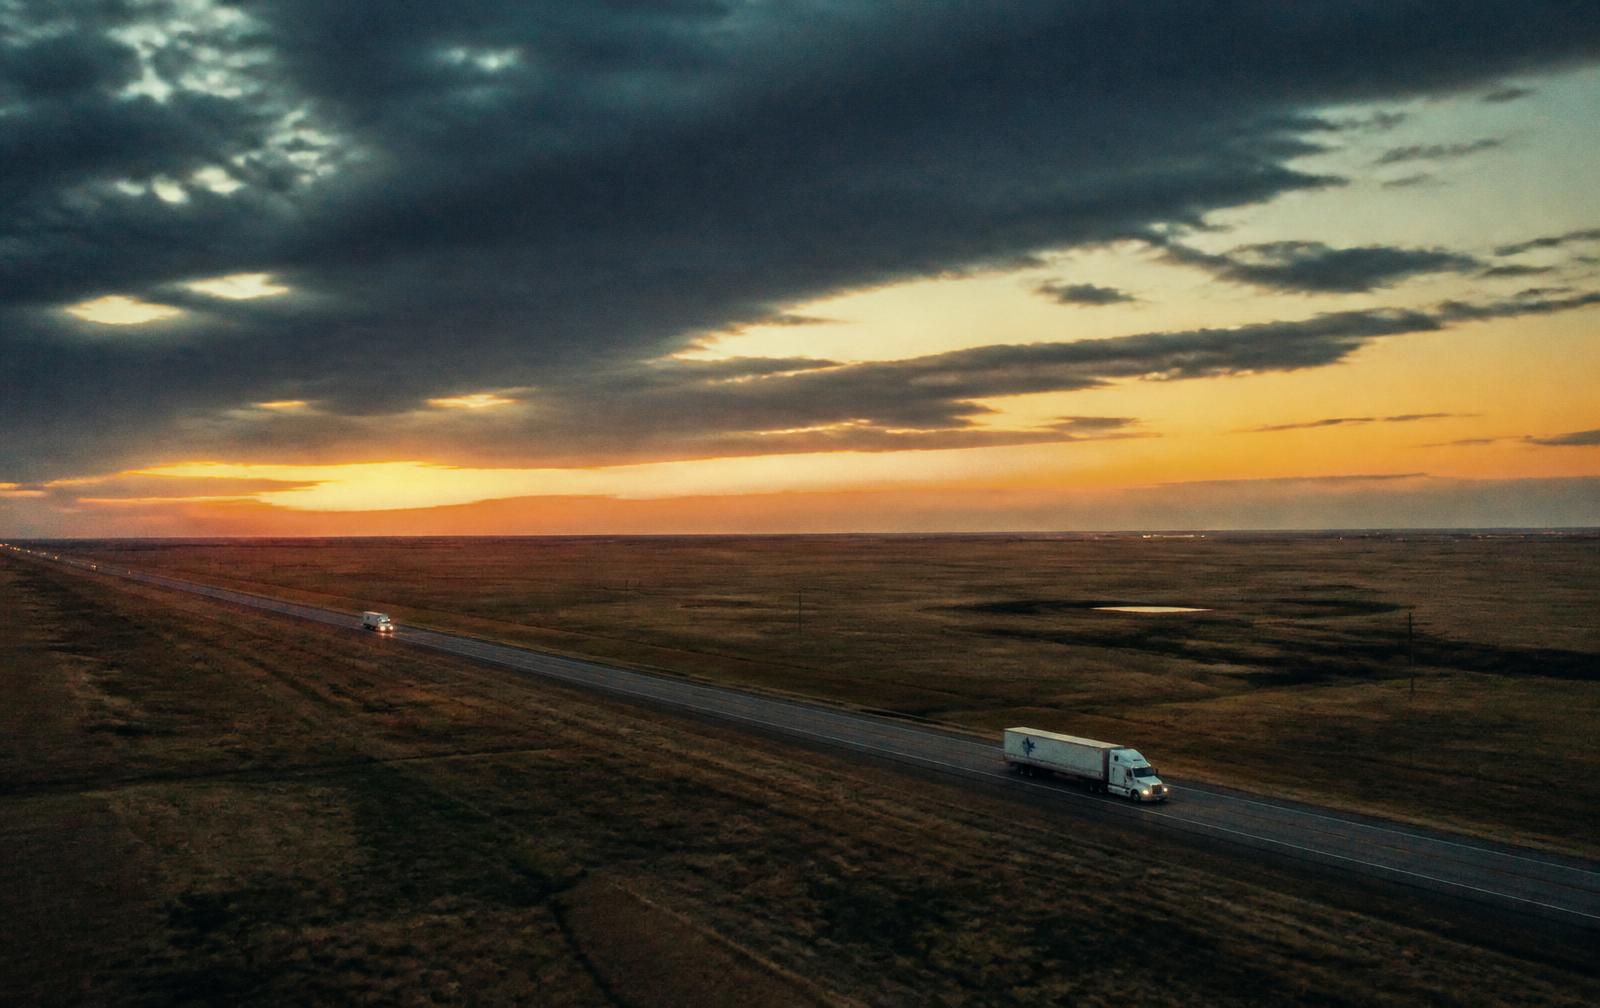
Dusk aerial of an interstate travel-center corridor
A SINGLE-TENANT NNN BUILD-TO-SUIT

LVPETROLEUM

TA BURLINGTON, CO
BURLINGTON - COLORADO - I-70
Total project cost
$36.81M
Senior loan
$31.29M
DSCR
1.53x
Tenant FY25 revenue
$1.08B
Scroll to explore ↓

A BURLINGTON ASSETSIZED BYCOST, RENT AND COVERAGE.

02 / Investment snapshot
01234567890123456789,012345678901234567890123456789,012345678901234567890123456789
$ total project cost

Atlas_Redwood_Burlington_Underwriting.xlsx dashboard

01234567890123456789,012345678901234567890123456789,012345678901234567890123456789
$ construction loan

85.0% senior LTC base case

0123456789,012345678901234567890123456789,012345678901234567890123456789
$ sponsor equity

Atlas equity, 15.0% of cost

0123456789.01234567890123456789
x stabilized DSCR

6.2% perm rate, 30-yr amortization

01234567890123456789.0123456789
% debt yield

Year-1 NOI divided by loan

01234567890123456789.0123456789
% levered IRR

10-year hold underwriting

Burlington corridor fallback preview
The asset

A TA Burlington, CO build-to-suit

Single-tenant absolute-NNN travel center development underwritten in Atlas_Redwood_Burlington_Underwriting.xlsx for LV Petroleum on the Burlington, Colorado corridor.

Detail A

Burlington location

Market
Burlington, Colorado
Corridor
I-70 / Eastern Colorado
Use
TA-branded travel center
Source
Workbook controls Burlington identity
Detail B

Development budget

Total cost
$36,809,862
Land
$5,000,000
Hard cost
$24,109,135
Cost basis
94,195 SF model basis
Detail C

Credit metrics

Year-1 NOI
$3,496,937
DSCR
1.53x
Debt yield
11.2%
Loan-to-value
62.6%
Detail D

Construction facility

Loan
$31,288,383
LTC
85.0%
Rate
SOFR + 400 bps
Final balance
$31,288,383
03 / Corridor

CONNECTED
by design.

Burlington anchors the Eastern Colorado travel-center story on I-70. The workbook frames a single-tenant TA development underwritten for LV Petroleum, with corridor demand, lease economics and senior debt sizing moving through one model.

  • Colorado corridorI-70
  • Project marketBurlington
  • Tenant FY2025 revenue$1.08B
  • Senior LTC85.0%
  • Hold underwriting10 yrs
04 / The facility in numbers

ADVANCE, COVERAGE AND UTILIZATION — SIZED OFF A CONTRACTED RENT.

Advance rate band
USD millions of senior loan
80%85% BASE90%

Loan $29.45M / $31.29M / $33.13M against total project cost of $36.81M.

Coverage through the hold
DSCR at permanent rate
YR 1YR 3YR 5YR 7YR 10

2.5% fixed annual escalations drive coverage from 1.53x to 1.91x over ten years.

Construction facility balance
USD millions, closing balance
CLOSEM3M6M9M12

Final model balance of $31.29M with $1.20M of capitalized construction interest.

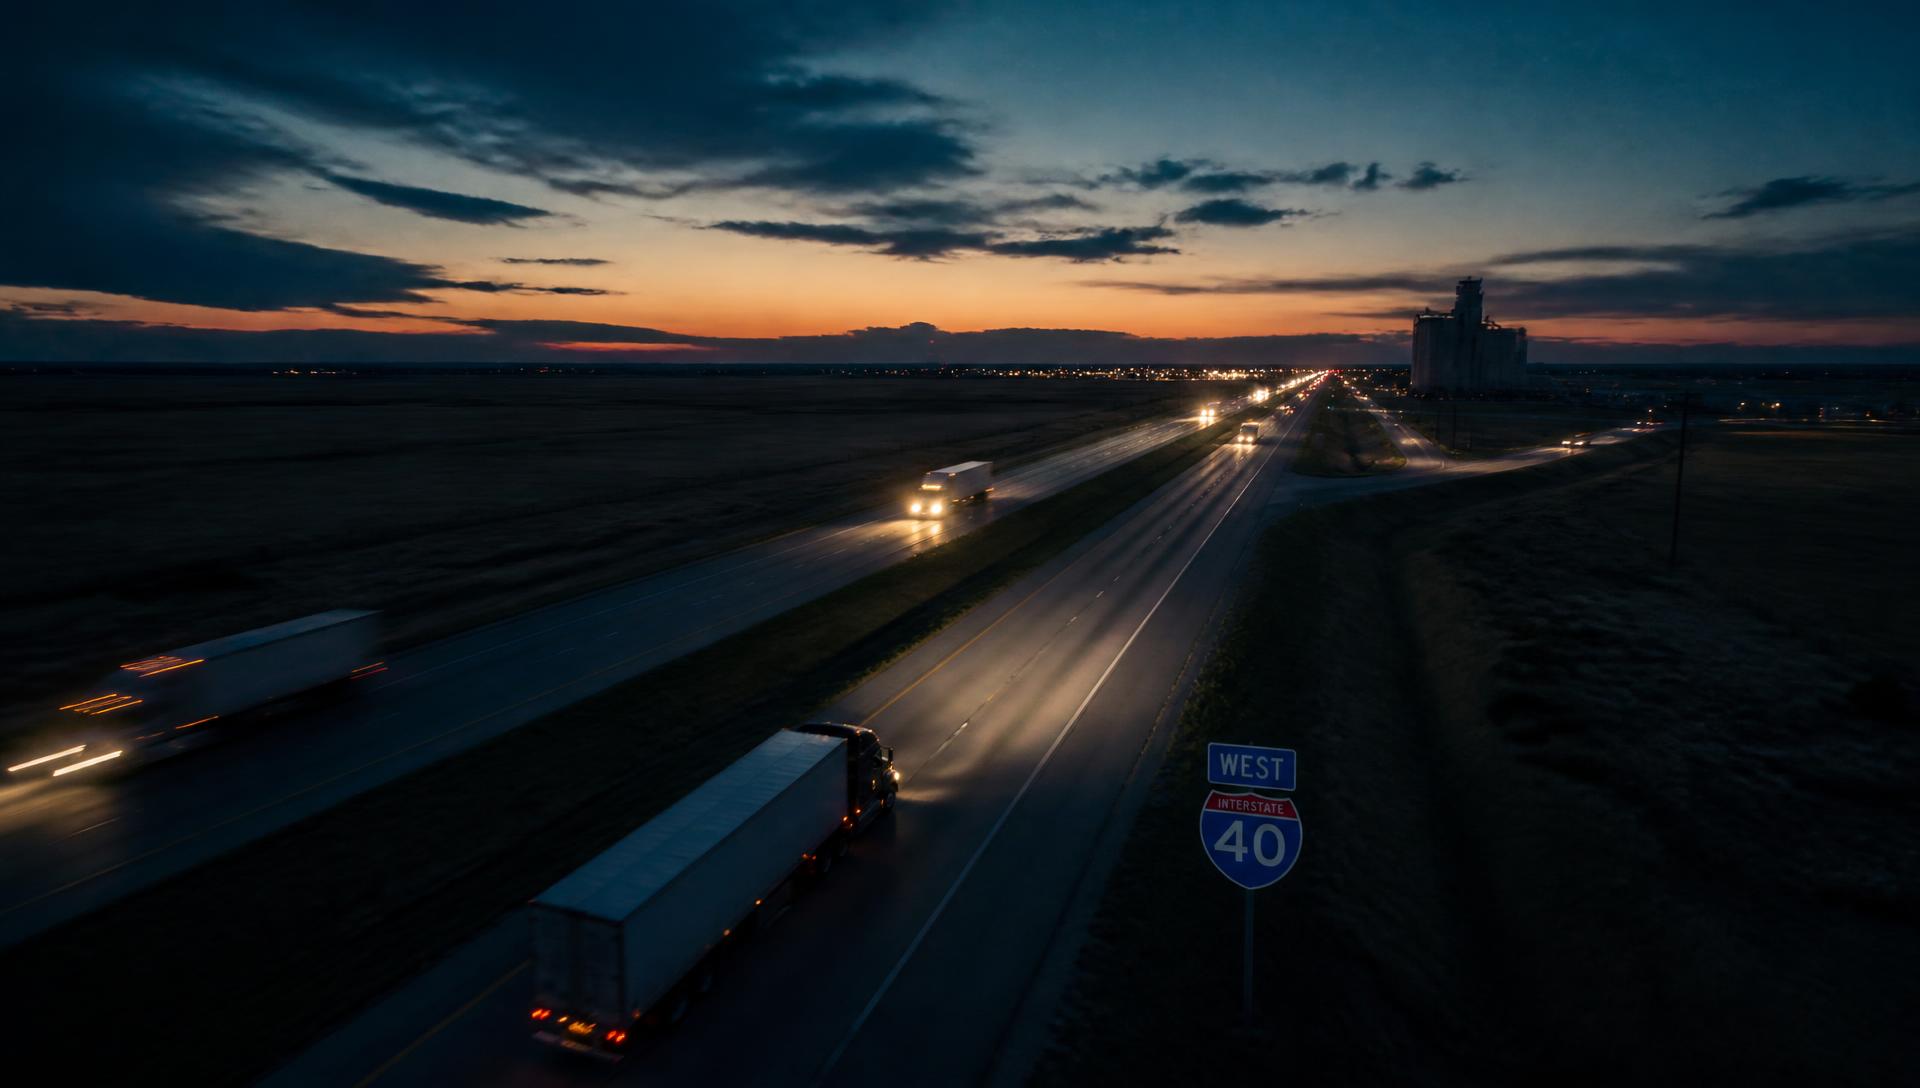
Interstate freight corridor near Burlington, Colorado

SIZED FOR
CLASS 8.

$36.81M
Total project cost
$24.11M
GC bid hard cost
$31.29M
Construction loan
12
Months construction
Burlington, Colorado - I-70 travel-center positioning.
01CORRIDORBurlington, Colorado - I-70 travel-center positioning.
Land, GC bid, soft costs, fees, and construction interest.
02BUDGETLand, GC bid, soft costs, fees, and construction interest.
Workbook coverage plus FY2025 LV Petroleum audit support.
03CREDITWorkbook coverage plus FY2025 LV Petroleum audit support.
05 / Investment thesis

WHY THIS asset.

  • 01LEASE

    The model underwrites a 30-year absolute-NNN lease with LV Petroleum, whose FY2025 audit reports $1077.54M of gross revenue.

  • 02COST

    Total project cost is $36.81M, including $5.00M of land, $24.11M of GC bid hard cost and a $1.20M construction interest reserve.

  • 03COVERAGE

    The 85.0% base-case loan produces 1.53x Year-1 DSCR, an 11.2% debt yield and 62.6% loan-to-stabilized-value at a 7.0% cap.

  • 04RETURNS

    The 10-year hold model shows 13.5% unlevered IRR, 35.9% levered IRR and an 8.99x levered equity multiple.

Zoom out
THE SITE
TA Burlington, CO

POSITIONED FOR
the next decade.

Part 01

The request

What is being asked for, and what secures it.

02 / Transaction at a glance

TA Burlington, CO - single-tenant NNN build-to-suit

The active project is the Burlington, Colorado TA travel-center development underwritten for LV Petroleum on a construction-to-permanent basis.

The asset
Project
Atlas Redwood - TA Burlington, CO
Location
Burlington, Colorado - I-70 / Eastern Colorado corridor
Program
TA-branded travel center with convenience, foodservice, truck service, fueling and forecourt infrastructure
Tenant/operator
LV Petroleum LLC
Lease
30-year absolute NNN underwriting with 2.5% annual rent escalations and no modeled non-reimbursables
Source priority
Atlas_Redwood_Burlington_Underwriting.xlsx controls model values; the Burlington construction-financing memo controls deck sequence and non-conflicting narrative.
The ask
Facility
Senior secured construction-to-permanent loan
Base loan amount
$31,288,383 at 85.0% senior loan-to-cost
Sponsor equity
$5,521,479 from Atlas, 15.0% of total project cost
Use of proceeds
Land, GC bid hard cost, soft costs, fees, construction interest and carry
Construction period
12-month build; permitting timeline shown in the memo schedule
Total project cost
$36,809,862
Total project cost
$36.81M
Dashboard C6
Senior loan
$31.29M
Dashboard C7, 85.0% LTC
Stabilized DSCR
1.53x
Dashboard C13
Levered IRR
35.9%
10-year hold returns
03 / Requested facility terms

Source-file construction-to-permanent request

Rates are based on SOFR of 3.65% as of 28 July 2026, with SOFR+400 during construction and SOFR+250 after permanent conversion.

Term
Requested provision
Facility type
Senior secured construction-to-permanent financing, single instrument
Loan amount
$31,288,383 base case; advance band shown from 80.0% to 90.0% of cost
Loan-to-cost
85.0% base case
Sponsor equity
$5,521,479, funded as 15.0% of total project cost
Construction pricing
SOFR + 400 bps, 7.65% at the workbook index
Permanent pricing
SOFR + 250 bps, 6.15% at the workbook index
Amortization
30-year amortization, annual debt constant 7.31%
Construction period
12-month build after permitting
Capitalized interest
$1,196,781
Annual debt service
$2,287,412
Valuation / exit cap
7.0% valuation / 7.2% exit
Selling cost
1.5% disposition cost in the exit model
04 / Advance rate and equity band

The ask across the 80.0% to 90.0% senior advance band

Every case holds the same total project cost, Year-1 NOI, permanent constant and stabilized value.

AdvanceSenior loanSponsor equityAnnual debt serviceYear-1 DSCRDebt yieldLTV
80.0%$29,447,890$7,361,972$2,152,8581.62x11.9%58.9%
85.0%$31,288,383$5,521,479$2,287,4121.53x11.2%62.6%
90.0%$33,128,876$3,680,986$2,421,9651.44x10.6%66.3%

The 85.0% base case is the active workbook case. The 80.0% and 90.0% cases are calculated from the same workbook total project cost and permanent debt constant.

Part 02

The project

The asset, the tenant, and who delivers it.

05 / Project snapshot

Burlington TA development underwritten for LV Petroleum

The memo describes a purpose-built TA-branded travel center on the Interstate 70 freight corridor, with the workbook supplying the current budget and sizing.

  1. 01

    TA Burlington, Colorado

    The active model identifies the project as Atlas Redwood - TA Burlington, CO, a single-tenant NNN travel-center development on the Burlington, Colorado corridor.

  2. 02

    LV Petroleum tenant/operator underwriting

    Lease economics are modeled around LV Petroleum. The FY2025 audit reports $1.08B of gross revenues, $1.72B of total assets and $223.83M of members' equity.

  3. 03

    GC bid hard cost

    The workbook carries $24.11M of hard cost from the GC bid, including the c-store/QSR and truck-service components.

  4. 04

    12-month construction S-curve

    The construction tab sizes monthly draws and capitalized interest over a 12-month construction period.

  5. 05

    Institutional return framing

    The returns tab shows a 10-year hold, 13.5% unlevered IRR and 35.9% levered IRR.

06 / Location and corridor

Burlington, Colorado corridor positioning

The memo identifies Burlington on Interstate 70 as the east-west freight corridor between Denver and Kansas City, near the Kansas line.

Market
Burlington
Colorado project location
Corridor
I-70
Eastern Colorado interstate access
Tenant
LV Petroleum
TA-branded operating tenant
Site
~15.2 ac
Memo project snapshot
Hold
10 yrs
Workbook return period
  1. 01

    Travel-center demand is corridor-driven

    The underwriting is built around long-haul highway traffic, truck service demand, fueling, foodservice and driver dwell time.

  2. 02

    Credit is lease-led

    The model treats tenant rent as the core repayment source through a single-tenant absolute-NNN structure.

  3. 03

    Replicable program, constrained sites

    The memo frames the 15.2-acre site around truck parking, bullpen, fueling canopies, convenience store, Starbucks QSR and truck service uses.

The site address is still a diligence item in the memo; title, survey, entitlement, environmental and geotechnical work remain conditions precedent.

07 / Tenant and lease

LV Petroleum lease economics support the sizing

The active workbook uses an absolute-NNN income profile with zero modeled non-reimbursables; the memo notes lease execution as a condition precedent.

Lease term
Provision
Tenant/operator
LV Petroleum LLC
Brand / project
TA Burlington, CO
Structure
Absolute triple-net underwriting; tenant pays all modeled operating costs
Term
30 years
Year-1 rent / NOI
$3,496,937
Yield on cost
9.50% of total project cost
Annual escalation
2.5% per year
Rent commencement
At certificate of occupancy; no free rent or abatement modeled
Brand
TravelCenters of America
Non-reimbursables
$0 in the workbook cash-flow model
Condition precedent
Definitive lease and guaranty form to be delivered in diligence before loan proceeds advance.

Tenant support status: LV Petroleum FY2025 audit facts are retained from the prior extracted audit support; the newest workbook/memo import did not include a readable audit file path.

FY2025 gross revenues
$1.08B
$692.08M increase from FY2024
Total assets
$1.72B
$0.58B at FY2024
Members' equity
$223.83M
$34.28M at FY2024
Operating footprint
30 states
16 states in FY2024
Audit income statement line20252024Source note
Gross revenues$1,077,540,270$385,457,950+179.5%
Fuel revenue$894,570,200$313,075,68183.0% of FY2025 gross revenue
Store revenue$98,171,024$42,253,328More than doubled
Restaurant revenue$61,820,710$22,737,370+172% per MD&A
Gross profit$310,432,418$112,006,91928.8% FY2025 gross margin
Net income$202,920,886$54,849,427Includes disposition gain
Audit balance sheet line20252024
Cash and cash equivalents$47,119,341$6,517,704
Total current assets$167,266,932$33,266,947
Right-of-use assets$993,097,900$419,965,308
Property and equipment - net$527,923,934$117,184,768
Total assets$1,716,700,496$580,808,063
Members' equity$223,828,086$34,283,151
08 / Delivery structure and parties

One project budget, multiple disclosed fee recipients

The Fee Compensation workbook tab discloses cash compensation by recipient, separate from any equity allocations.

PartyRoleBasis of engagement
Atlas RedwoodSponsor / borrowerAtlas equity funds the 15.0% base-case sponsor contribution
LV Petroleum LLCTenant / operatorFY2025 audit reports $1.08B of gross revenues across 30 states
Basalt Capital PartnersDeveloper / owner's representative / capital-placement advisor / general contractorDevelopment services, owner's representation, AIA-style GMP delivery and capital advisory
Mile Post DevelopmentTenant representation / site sourcingTenant representation and site-selection fee in the budget
RecipientCash amountBasis
Basalt Capital Partners$3,012,994$789,438 development + $1,205,457 GC + $650,000 owner rep + $368,098 arrangement
Atlas Group$894,391$526,292 development + $368,099 arrangement
Mile Post Development$1,205,4575.0% of hard costs
Total cash fees$5,112,841Approximately 13.9% of total project cost

General partner interests described in the source materials are equity allocations and are not included as cash project costs in the fee table.

09 / Schedule and milestones

From site control to rent commencement

The memo lays out site acquisition, permitting, construction start and certificate of occupancy; the workbook sizes the reserve on a 12-month construction build.

Oct 2026

Property acquisition

Site closing and loan closing; land, financing fees and tenant representation fee fund at close.

Oct 2026 - Mar 2027

Permitting

Six-month entitlement and permitting period, with final design and GMP buy-out completed.

Q2 2027

Construction start

Notice to proceed under the GMP contract; draws begin against the schedule of values.

Q1 2028

Topping out

Peak facility utilization; owner's representation engagement runs through the core build period.

Q2 2028

Certificate of occupancy

Rent commences; the facility converts to permanent debt service and begins amortizing.

Stabilization

Permanent debt service

$2,287,412 annual debt service against Year-1 NOI of $3,496,937.

Permitting
6 mo
Memo schedule
Construction
12 mo
Workbook assumption H18
Capitalized interest
$1.20M
Dev Budget C15 / Construction C28
Final balance
$31.29M
Construction C27
Free rent
None
Memo lease structure

The workbook reserve uses the 12-month construction convention; site-control, title, survey, entitlement, environmental and geotechnical diligence remain conditions precedent before any advance.

Part 03

Underwriting

The budget, the coverage, and how the loan is repaid.

10 / Sources and uses of funds

Total project cost $36,809,862

The development budget tab supplies the full sources-and-uses table and a zero balance check.

Uses of fundsAmount% of cost$ / SF
Land acquisition$5,000,00013.6%$53.08
Hard costs - fixed as GMP$24,109,13565.5%$255.95
Soft costs - design, engineering, permitting, legal, FF&E$1,000,0002.7%$10.62
Tenant representation and site selection fee$1,205,4573.3%$12.80
Development fee$1,315,7303.6%$13.97
General contracting fee$1,205,4573.3%$12.80
Owner's representation fee$650,0001.8%$6.90
Financial arrangement fee$736,1972.0%$7.82
Loan origination and closing fees$391,1051.1%$4.15
Capitalized interest reserve$1,196,7813.3%$12.71
Total uses$36,809,862100.0%$390.78
Sources of fundsAmount% of costLTC / LTV
Construction loan$31,288,38385.0%85.0%
Sponsor equity - Atlas$5,521,47915.0%
Total sources$36,809,862100.0%
Fee compensation

Sources equal uses with a zero workbook balance check. Sponsor equity is first-loss capital beneath the senior construction loan.

RecipientCash amountBasis
Basalt Capital Partners$3,012,994Development, GC, owner representation and arrangement fees
Atlas Group$894,391Development and arrangement fee share
Mile Post Development$1,205,457Tenant representation and site-selection fee
Total cash fees$5,112,841Approximately 13.9% of total project cost

The fee table is embedded in project uses and is disclosed separately from GP equity allocations.

11 / Draw schedule and interest reserve

Final construction balance $31,288,383

Construction-rate interest accrues monthly and is capitalized into the facility balance.

PeriodS-curveCost drawDebt drawLoan reserve drawClosing balance
Close0.0%$7,332,759$6,232,845$0$6,232,845
Month 110.0%$2,828,032$2,403,827$84,772$8,721,445
Month 210.0%$2,828,032$2,403,827$84,772$11,210,044
Month 310.0%$2,828,032$2,403,827$84,772$13,698,643
Month 410.0%$2,828,032$2,403,827$84,772$16,187,243
Month 510.0%$2,828,032$2,403,827$84,772$18,675,842
Month 610.0%$2,828,032$2,403,827$84,772$21,164,441
Month 78.3%$2,356,694$2,003,189$84,772$23,252,403
Month 88.3%$2,356,694$2,003,189$84,772$25,340,364
Month 98.3%$2,356,694$2,003,189$84,772$27,428,326
Month 105.0%$1,414,016$1,201,914$84,772$28,715,012
Month 115.0%$1,414,016$1,201,914$84,772$30,001,697
Month 125.0%$1,414,016$1,201,914$84,772$31,288,383
Total / final$35,613,081$30,271,119$1,017,264$31,288,383
How the reserve is sized
Construction rate
7.65%
Construction period
12 months
LTC debt share
85.0%
Constructible base
$28,280,322
Capitalized construction interest
$1,196,781
Draw-schedule accrual memo
$1,546,877
Final / peak construction balance
$31,288,383

The active workbook reserve is $1.20M under the MOU convention. The construction tab also flags a $1.55M draw-schedule accrual memo, a $350k variance to be re-sized against the final schedule of values at term sheet.

12 / Credit metrics

Coverage at stabilization and through the hold

Year 1 begins at stabilization. Escalations compound while annual debt service is held constant in the model.

DSCR - Year 1
1.53x
NOI / annual debt service
Debt yield
11.2%
Year-1 NOI / loan
Loan-to-value
62.6%
Against 7.0% cap value
Development spread
250 bps
9.50% yield vs 7.0% cap
Stabilized credit profile - 85.0% base case
Amount
Year-1 NOI
$3,496,937
Annual debt service
$2,287,412
Levered cash flow after debt service
$1,209,525
Mortgage constant
7.31%
Stabilized value at 7.0% cap
$49,956,241
Value-to-loan cushion
1.60x
Supportable loan - binding LTC sizing
$31,288,383
Headroom to supportable loan
$0
Coverage through the holdNOIDSCRDebt yieldEOY loan balance
Year 1$3,496,9371.53x11.2%$30,914,793
Year 3$3,673,9691.61x11.7%$30,095,214
Year 5$3,859,9641.69x12.3%$29,168,656
Year 7$4,055,3751.77x13.0%$28,121,154
Year 10$4,367,1951.91x14.0%$26,288,045

Debt yield is calculated on the original $31.29M loan amount. Against the amortizing balance it improves further through the hold.

13 / Sensitivity

Value, coverage and sizing constraints

Each grid holds other workbook inputs constant.

Stabilized value - yield on cost versus exit cap
YoC / Cap6.50%6.75%7.00%7.25%7.50%
9.00%$50.97M$49.08M$47.33M$45.70M$44.17M
9.25%$52.38M$50.44M$48.64M$46.96M$45.40M
9.50%$53.80M$51.81M$49.96M$48.23M$46.63M
9.75%$55.21M$53.17M$51.27M$49.50M$47.85M
10.00%$56.63M$54.53M$52.59M$50.77M$49.08M
Stabilized DSCR - yield on cost versus permanent rate
YoC / Rate5.65%6.15%6.65%7.15%7.65%
9.00%1.53x1.45x1.37x1.31x1.24x
9.25%1.57x1.49x1.41x1.34x1.28x
9.50%1.61x1.53x1.45x1.38x1.31x
9.75%1.66x1.57x1.49x1.42x1.35x
10.00%1.70x1.61x1.53x1.45x1.38x
Permanent debt sizing - binding constraint
Sizing testAmountWorkbook note
Max LTC - 85.0% of cost$31,288,383Requested advance rate
Max LTV - 65% of value$32,471,557Permanent LTV ceiling
Max at 1.25x DSCR$38,266,308NOI / DSCR / constant
Max at 10% debt yield$34,969,369NOI / min debt yield
Supportable loan$31,288,383Binding minimum
Requested loan$31,288,383Active base case
Headroom$0Supportable less requested

The requested loan is set by the MOU advance rate, so loan-to-cost is the binding sizing test by construction. LTV, DSCR and debt-yield tests provide additional conversion headroom.

14 / Repayment and exit

Permanent amortization first, sale optionality second

The base case does not require a sale for repayment; the exit model is used to frame investor return outcomes.

Primary

Permanent amortization

The facility is sized against Year-1 NOI and permanent debt service, with coverage rising from 1.53x to 1.91x over the hold.

Secondary

Sale at 7.25% exit cap

The exit model uses forward NOI of $4.48M, exit value of $61.74M and net sale proceeds of $60.82M before loan payoff.

Return outcome

Levered equity performance

The 10-year model produces a 35.9% levered IRR, 8.99x levered equity multiple and $44.10M of levered profit.

Returns summary
MetricUnleveredLevered / equityDevelopment
IRR13.5%35.9%
Equity multiple2.62x8.99x
Profit$59,687,675$44,101,308$13,146,379
Profit margin35.7%
Development spread250 bps
Illustrative partnership waterfall
Waterfall itemAmountNote
Total equity invested$5,521,479Atlas equity
Total levered distributions$49,622,78710-year model
Preferred return hurdle$6,398,9808.0% pref
Return of capital plus pref$11,920,459Before residual split
Residual profit above pref$37,702,328Subject to promote
GP promote$7,540,46620.0% promote
LP total$42,082,321Capital, pref and residual
LP equity multiple7.62xWorkbook waterfall C17
15 / Key risks and mitigants

Named in the Burlington memo

Every item below is disclosed in the source memo and aligned to the active workbook values.

Risk
Mitigant / status
Lease not yet executed
Lease execution is a condition precedent to closing. No loan proceeds advance before the definitive lease and guaranty form are delivered.
Single-tenant concentration
30-year absolute-NNN lease structure, fixed 2.5% escalations and corporate guaranty support the credit; coverage improves annually.
First project of the program
Burlington is framed as the first planned site, delivered as a single fully committed asset before broader platform scale.
Construction cost and timing
Hard cost is fixed under a GMP framework, with draw review, retainage, change-order governance and completion support to be documented before closing.
Floating-rate exposure
Both rates float with SOFR. Coverage holds above 1.25x to the workbook break-even permanent-rate headroom and a rate cap will be evaluated at closing.
Related-party structure
Basalt acts as developer, owner's representative and general contractor and is separately disclosed in the cash-fee and GP-interest structure.
Site control and entitlement
Site address, title, survey, entitlement, environmental and geotechnical diligence remain conditions precedent before advance.
Tenant diligence
Repayment rests on LV Petroleum rent; retained audit support shows $1.08B of gross revenues, $1.72B of total assets and 30-state operating scale.
16 / Sponsor, parties and contacts

Next steps

Diligence materials should be kept under NDA; retained FY2025 tenant audit facts inform the tenant support shown in this deck.

ContactRoleDetail
Basalt Capital PartnersCapital and development contactPalm Beach Gardens, Florida - coordinates financing request and diligence package
Atlas RedwoodSponsor / borrowerProject sponsor and equity provider for the Burlington TA development
LV Petroleum LLCTenant / operatorFY2025 audit support: $1.08B gross revenues, $1.72B total assets, $223.83M members' equity
Mile Post DevelopmentTenant representation / site sourcingFee compensation shown in the workbook source

Requested diligence package: executed or draft lease, guaranty form, Burlington site plan, survey, title, environmental, entitlement materials, GC bid support, live workbook and source memo reconciliation.

17 / Disclaimer

Basis of preparation and confidentiality

No offer or commitment

This website and PDF deck are prepared for discussion purposes only. They are not an offer, solicitation or commitment to lend, invest or proceed.
Source hierarchy

Atlas_Redwood_Burlington_Underwriting.xlsx controls active Burlington project identity and all model values. The construction-financing memo PDF controls page sequence, hierarchy and non-conflicting narrative. Retained LV Petroleum audit facts remain in this data set from the prior extraction.

Forward-looking information

Budgets, rents, coverage ratios, valuations, debt sizing and returns are estimates based on the active workbook assumptions. Actual results may differ materially.

Source normalization

The memo PDF body and footer identify Burlington, Colorado / Interstate 70. The cover carries a legacy place typo, so this presentation normalizes the active project location to Burlington, Colorado.

Confidentiality

The contents are confidential and furnished solely for evaluation by intended recipients and their advisers.

Recipients should perform their own diligence and consult legal, tax, technical and financial advisers before relying on any underwriting output.

A LEASE.A MODEL.A FACILITY.

A $36,809,862 TA Burlington, CO travel center - one $31,288,383 senior construction-to-permanent facility at 85.0% LTC, underwritten against LV Petroleum lease economics and 2.5% fixed escalations.

Basalt Capital Partners - Palm Beach Gardens, FloridaAtlas Redwood - TA Burlington, CO - LV Petroleum12 August 2026 - Privileged & confidential